One page of your own entries, for your next appointment
A short appointment is a hard place to describe three months from memory. Pera keeps the record for you and puts it on one page a doctor can read in a minute.
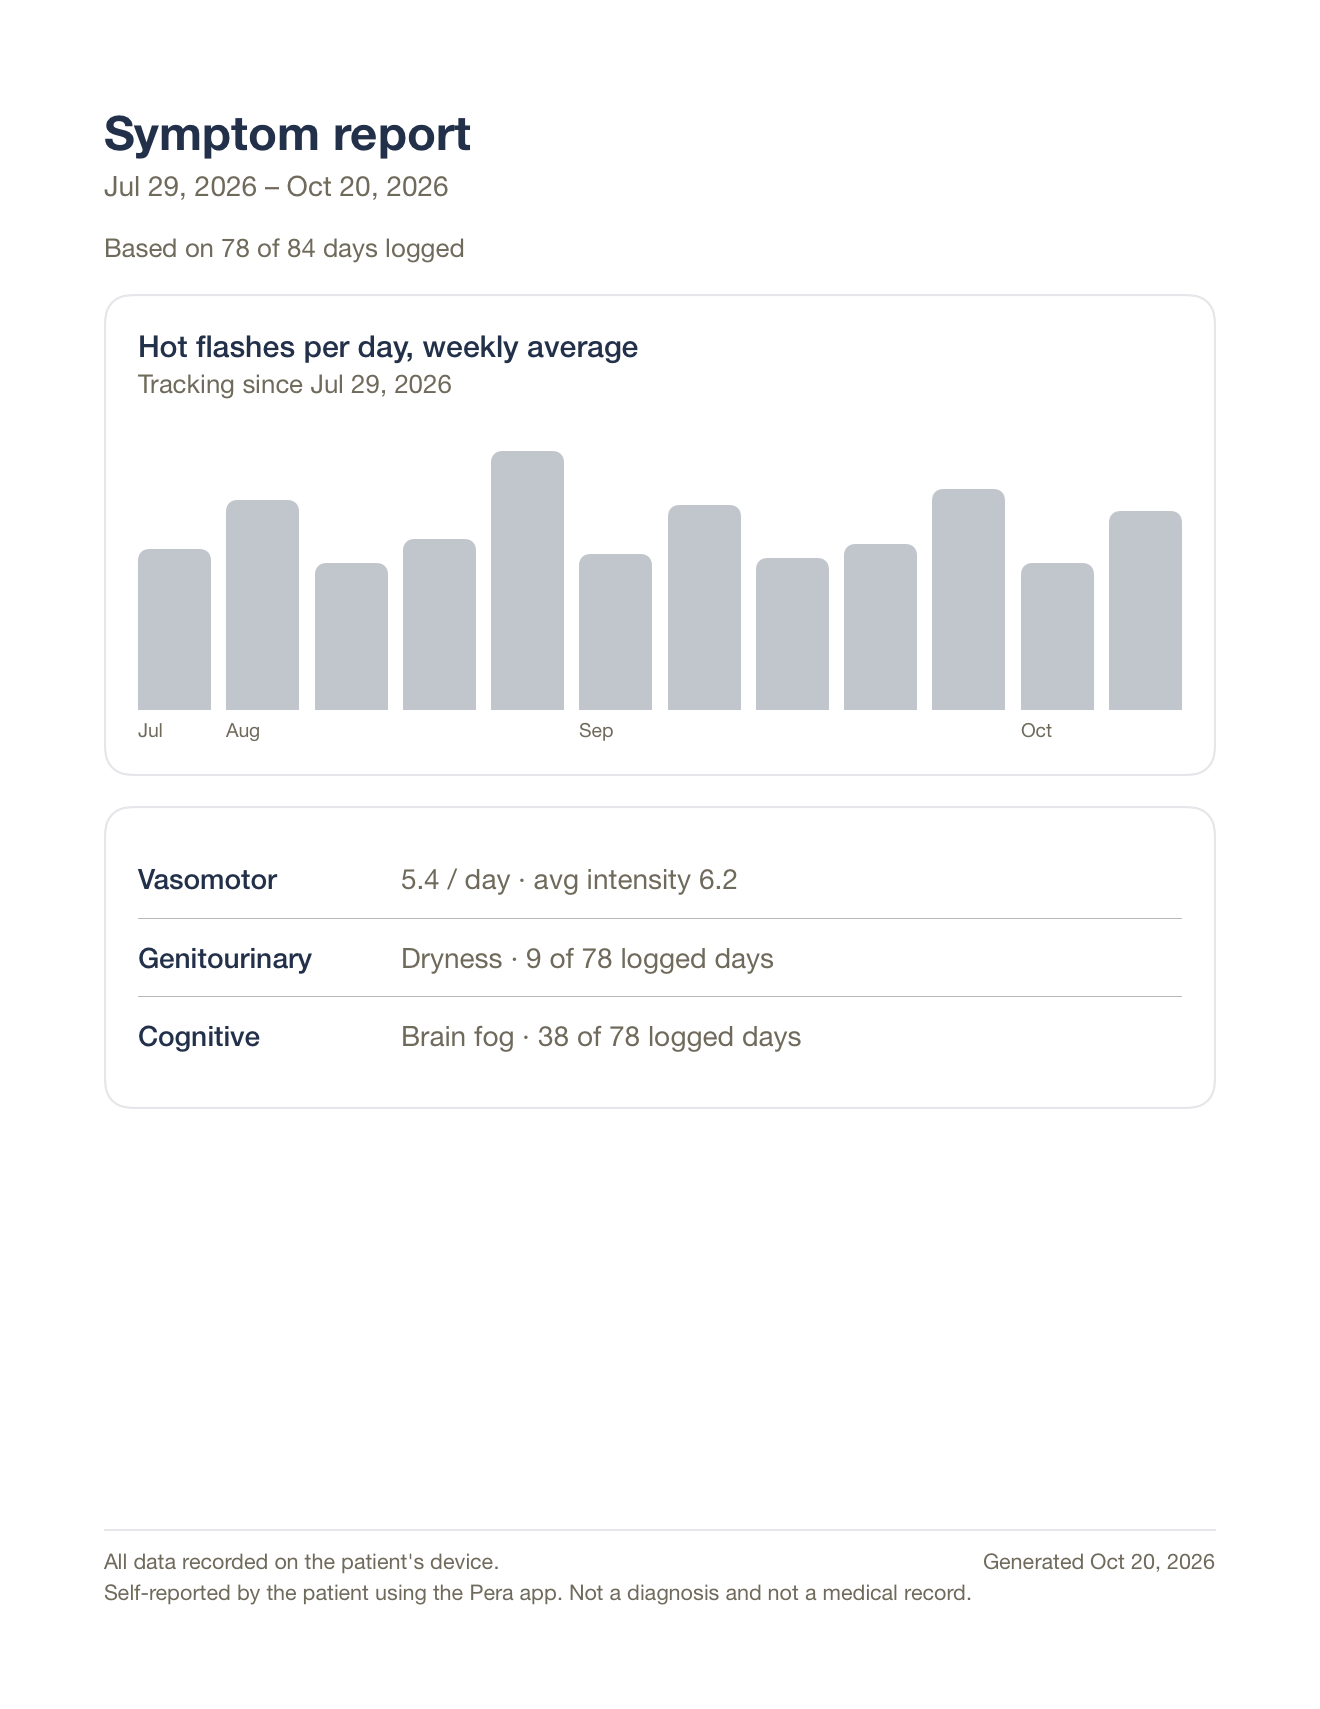
What’s on the page
- the dates the report covers: your last 84 days;
- how many of those days you logged;
- a week-by-week chart of your hot flashes, as an average per day;
- a summary of what you logged, such as how many days you noted brain fog or dryness;
- the date you started HRT, if you added one in the app.
Every line comes from what you entered. Pera doesn’t add conclusions, scores, or advice. The page says so at the bottom: it is self-reported, not a diagnosis, and not a medical record.
Why 84 days
Twelve weeks is long enough to show a pattern, not a bad week. That is the window Pera’s report uses. It’s a choice we made for the report, not a medical standard.
How to share or print it
- Open Pera and tap PDF on the main screen.
- Tap Export PDF for Doctor.
- Choose where it goes: print it, save it to Files, or send it by email or message.
The PDF only goes where you send it.
Subscription: $39.99 every 3 months, renews automatically until you cancel. US prices; the price in your country is shown in the app before you buy. No free trial. Available on the App Store for iPhone.
This page describes the Pera app and how to keep a record of your symptoms. It is general information, not medical advice. For questions about your health, talk to your doctor.